
The provided graphs illustrate temperature and rainfall data for Brisbane and Canberra throughout th ...
Daily Exercise by Age Group (Bar Chart)
Writing Task 1 · Bar Chart · Tối thiểu 150 từ
Đề bài
The provided graphs illustrate temperature and rainfall data for Brisbane and Canberra throughout the year, revealing how these two Australian cities experience different climatic patterns.
Dàn ý gợi ý
Mở bài (Introduction)
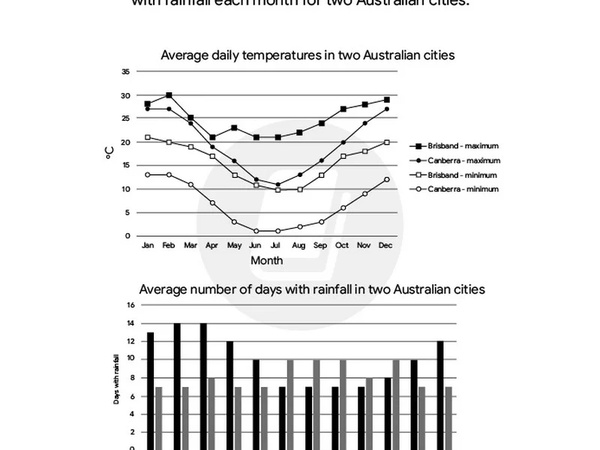
The graph and chart below give information on the average daily maximum and minimum temperatures in degrees Celsius and the average number of days with rainfall each month for two Australian cities. Summarise the information by selecting and reporting the main features and make comparisons where relevant
Cả hai thành phố đều có các mô hình nhiệt độ theo mùa riêng biệt, với Brisbane nói chung ấm hơn Canberra trong suốt cả năm. Phân phối mưa cho thấy sự biến đổi đáng kể giữa hai địa điểm, đặc biệt là trong các tháng mùa hè.
Section 2 — Overview
Both cities exhibit distinct seasonal temperature patterns, with Brisbane generally warmer than Canberra throughout the year. The rainfall distribution shows significant variation between the two locations, particularly during the summer months.
Cả hai thành phố đều có các mô hình nhiệt độ theo mùa riêng biệt, với Brisbane nói chung ấm hơn Canberra trong suốt cả năm. Phân phối mưa cho thấy sự biến đổi đáng kể giữa hai địa điểm, đặc biệt là trong các tháng mùa hè.
Section 3 — Body 1
During winter months (June-August), both cities experience their lowest temperatures, with Canberra showing more dramatic drops in minimum temperatures compared to Brisbane. The summer period (December-February) sees peak temperatures, with Brisbane consistently recording higher maximums. Rainfall patterns differ significantly, with Brisbane experiencing more rainy days during summer while Canberra has relatively consistent rainfall throughout the year.
Trong các tháng mùa đông (tháng 6-8), cả hai thành phố đều trải qua nhiệt độ thấp nhất, với Canberra cho thấy sự sụt giảm nhiệt độ tối thiểu rõ rệt hơn so với Brisbane. Giai đoạn mùa hè (tháng 12-2) chứng kiến nhiệt độ cao nhất, với Brisbane liên tục ghi nhận nhiệt độ tối đa cao hơn. Mô hình mưa khác biệt đáng kể, với Brisbane trải qua nhiều ngày mưa hơn trong mùa hè trong khi Canberra có lượng mưa tương đối ổn định trong suốt cả năm.
Section 4 — Body 2
In summary, Brisbane maintains consistently higher temperatures year-round with more pronounced summer rainfall, while Canberra experiences greater temperature extremes and more evenly distributed rainfall. These climatic differences reflect the geographical variations between coastal and inland Australian cities.
Tóm lại, Brisbane duy trì nhiệt độ cao hơn nhất quán quanh năm với mưa mùa hè rõ rệt hơn, trong khi Canberra trải qua các cực đoan nhiệt độ lớn hơn và mưa phân phối đều hơn. Những khác biệt khí hậu này phản ánh sự biến đổi địa lý giữa các thành phố ven biển và nội địa Úc.